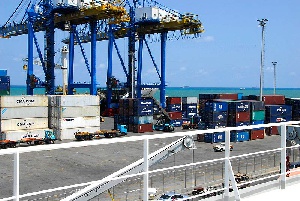
The Takoradi Port last year recorded an annual total vessel calls of 1,601 compared to 1,525 calls in 2015. Showing a positive variance of 76units representing an increase of 5%.
The increase recorded, is as a result of an increase in offshore supply vessels servicing Ghana’s Oil fields. Out of 1,610 vessel calls, 928 are attributed to supply vessels representing 58% of total vessel calls to the port in 2016.
Mr. Peter Amo-Bediako, Public Affairs and Marketing Manager at the Takoradi Port told the B&FT in an interview that imports recorded through the port was 2,188,998 metric tons (m/t) in 2016 compared to 1,746,058m/t in 2015.
He explained that this shows a difference of 442,940m/t representing a positive variance of 25% - import commodities that contributed to the increase in the year 2016 includes clinker (25%), gypsum (141%), limestone (57%), wheat (29%) as well as general cargo (58%).
He said exports through the port recorded a total of 3,731,779 m/t in 2016 compared to 2,836,649m/t in 2015. Showing an increase of 895,130m/t representing a positive variance of 32%.
“Export commodities that contributed to the increase in 2016 were bauxite (17%), manganese (59%), sawn timber (15%) and cocoa beans (19%)” he said.
Also, he said transit imports to the land locked countries of Niger, Mali and Burkina Faso recorded 81,705 m/t in 2016 as compared to 60,250 m/t in 2015.
This, he said shows a difference of 21,455 m/t which represents 36%- the positive variance is as a result of increase in ammonium nitrate transit to Burkina Faso and Cote D’ivore as well as bulk wheat to Burkina Faso.
However, Mr. Amo-Bediako said total container traffic registered negative growth during the period 2016 compared to same period in 2015. In 2016, the port recorded 48,622 (twenty foot equivalent units) teus compared to 58,093teus in 2015 a decrease of 9,471 teus representing -16%.
“With reference to the container traffic indicators, though some of the performance indicators shows positive growth such as transshipment inward (150%), transit-in (151%), the major area that contributed to the negative growth are imports which recorded -17% with exports recording -16%” he added.
He explained that the decrease recorded in import traffic was as a result of a drop in empty containerized import which recorded 3,719 teus in 2016, compared to 9,346 teus same period in 2015- the difference of 5,627 teus representing a negative variance of 60%.
On export, laden containers, he said it also recorded 19,041 teus in 2016, below the figure 26,007 teus in 2015, a difference of 6,966 teus representing negative variance of 28%.
Again, he said containerized commodities that caused the decrease exports were cocoa beans (bulk and bagged), veneer, teak products and palm kennel shells.
“Overall, annual total port traffic in 2016 recorded 6,045,050 m/t increase compared to that 4,699,166 m/t, recorded in 2015. The difference of 1,345,884 m/t represents a positive variance of 29%” he said.
Largely, he added that the positives are as a result of increases recorded in cargoes handled through the port of Takoradi, such as clinker, gypsum, limestone, bulk wheat, general cargo bauxite, manganese and sawn timber.
COMPARATIVE PORT PERFORMANCE (2015/2016)
YEAR
DESCRIPTION
2015
2016
VARIANCE
VAR %
VESSEL CALL(UNITS)
1,525
1,601
76
5
IMPORT(M/T)
1,746,058
2,188,998
442,940
25
EXPORT(M/T)
2,836,649
3,731,779
895,130
32
CONTAINER TRAFFIC(TEU’s)
58,093
48,622
-9.471
-16
TRANSIT – IN (M/T)
60,250
81,705
21,455
36
PORT TRAFFIC (M/T)
4,699,166
6,045,050
1,345,884
29
Business News of Thursday, 9 February 2017
Source: b&ft.com


